' fill='none' stroke='%23304560' stroke-miterlimit='10' stroke-width='2'/%3e%3c/svg%3e)

ANOVA, LM, LMM, GLM, GLMM, HGLM? Which statistical method should I use?
Dr. Vanessa Cave
13 December 2021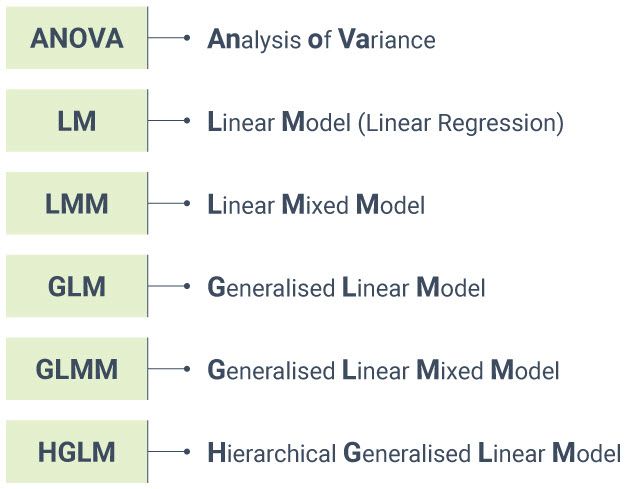
Unsure which statistical method is appropriate for your data set? Want to know how the different methods relate to each one another?
The simple diagram below may help you.
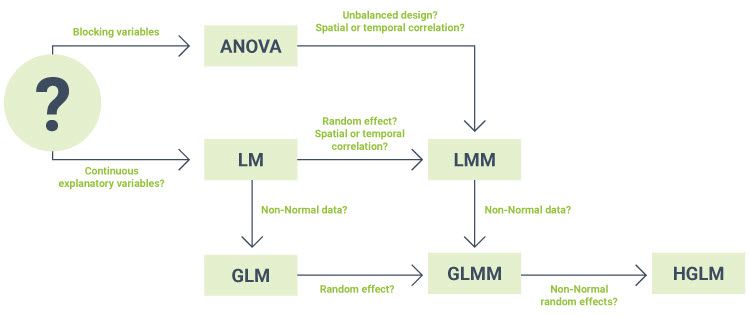
| Treatment factor | Categorical explanatory variable defining the treatment groups. In an experiment, the experimental units are randomly assigned to the different treatment groups (i.e., the levels of the treatment factor). |
| Blocking variable | Factor created during the design of the experiment whereby the experimental units are arranged in groups (i.e., blocks) that are similar to one another. You can learn more about blocking in the blog Using blocking to improve precision and avoid bias. |
| Continuous predictor | A numeric explanatory variable (x) used to predict changes in a response variable (y). Check out the blog Pearson correlation vs simple linear regression to learn more. |
| Unbalanced design | An experimental design is unbalanced if there are unequal sample sizes for the different treatments. Genstat provides users with a tool to automatically determine whether ANOVA, LM (i.e., regression) or LMM (i.e., a REML analysis) is most appropriate for a given data set. Watch this YouTube video to learn more. |
| Temporal correlation | Occurs when repeated measurements have been taken on the same experimental unit over time, and thus measurements closer in time are more similar to one another than those further apart. To learn more, check out our blog A brief introduction to modelling the correlation structure of repeated measures data. |
| Spatial correlation | Occurs when experimental units are laid out in a grid, for example in a field trial or greenhouse, and experimental units that are closer together experience more similar environmental conditions than those which are further apart. For more information, read our blog A brief look at spatial modelling. |
| Random effects | Represents the effect of a sample of conditions observed from some wider population, and it is the variability of the population that is of interest. The blog series A lightning introduction to linear mixe models for designed experiments can help you understand the difference between fixed and random effects. |
About the author
Dr Vanessa Cave is an applied statistician interested in the application of statistics to the biosciences, in particular agriculture and ecology, and is a developer of the Genstat statistical software package. She has over 15 years of experience collaborating with scientists, using statistics to solve real-world problems. Vanessa provides expertise on experiment and survey design, data collection and management, statistical analysis, and the interpretation of statistical findings. Her interests include statistical consultancy, mixed models, multivariate methods, statistical ecology, statistical graphics and data visualisation, and the statistical challenges related to digital agriculture.
Vanessa is currently President of the Australasian Region of the International Biometric Society, past-President of the New Zealand Statistical Association, an Associate Editor for the Agronomy Journal, on the Editorial Board of The New Zealand Veterinary Journal and an honorary academic at the University of Auckland. She has a PhD in statistics from the University of St Andrew.
Popular


Related Reads