' fill='none' stroke='%23304560' stroke-miterlimit='10' stroke-width='2'/%3e%3c/svg%3e)

The rule of three: Statistical pioneers at Rothamsted
Prof. Stephen Senn
11 January 2022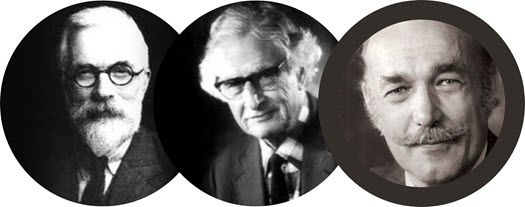
The importance of deciding whether it is necessary to use nitrogen in manures needs no further comment. It was to settle definitely questions like this that John Bennet Lawes began his experiments at Rothamsted in Hertfordshire on the manuring of crops.
T B Wood (1913), The Story of a Loaf of Bread, p4.
The towering trio: Rothamsted's statistical titans
Three great heads of statistics at Rothamsted made important contributions to the design and analysis of experiments. Ronald Aylmer Fisher (1890-1962) was at Rothamsted Experimental Station from 1919 to 1933, initially as the sole statistician and then as the head of statistics. When he left to become Galton Professor of Eugenics at University College London he was succeeded as head of statistics by Frank Yates (1902-1994), who had only arrived to work at Rothamsted two years earlier. Yates was to remain the head of statistics for 35 years. When he retired in 1968, his successor was John Nelder (1924-2010), who had previously worked briefly at Rothamsted but who was, at the time of his appointment, head of statistics at The National Vegetable Research Station in Wellesbourne. John Nelder remained head until his retirement in 1984.
All three made considerable contributions to many fields of statistics and Fisher also to genetics and evolutionary biology. Yates worked on sampling theory and computing, Nelder on computing and modelling and Fisher on just about everything. A common interest of all three, however, was the design and analysis of experiments. Together they created what I like to think of as The Rothamsted School of design and analysis of experiments. Of course, they were not the only statisticians who did this. Many others who worked at Rothamsted made important contributions, as did others elsewhere. Nevertheless, the work of these three was crucial and the theory they created has been extremely influential, although not, as I shall explain in due course, as influential as it deserves to be.
Field work and agricultural applications
An important context for the development of this theory was that agriculture was the field (a word that always causes one to pause, given the subject) of application. Agricultural scientists were ingenious and ambitious in constructing complex experiments. Typically a field would be subdivided into plots, to which treatments would be applied, but it could be that other treatments were applied at a lower subplot level. Due to spatial autocorrelation in fertility, variation between plots would generally be higher than variation between subplots. Thus, care had to be taken in judging whether the effects of the treatments applied differed from each other by more than could be expected by chance. Discovering exactly how this should be done is something that took half a century, and all the three heads made important contributions.
In 1910 Thomas Barlow Wood (1869-1929), an agricultural scientist, and Frederick John Marrian Stratton (1881-1960), an astronomer, collaborated to write a paper that described how the accuracy of results from an agricultural experiment could be estimated [1]. They showed how a technique that astronomers had long been using to assess the reliability of a mean of a number of differing observations could be applied to agricultural yields also. (They took an example of the percentage of dry matter in 160 roots of a variety of Golden Globe mangold.) They also showed how two treatments could be compared.
Astronomers and agronomists: Advancing the theory of errors
The theory of errors was well established amongst astronomers. George Bidell Airy (1801-1892) had written a monograph on the subject [2] in 1862 that had become a standard work of reference. From a modern perspective, it is slightly surprising that Wood and Stratton felt it necessary to explain a common technique amongst astronomers to agronomists but as they put it:
It might seem at first that no two branches of study could be more widely separated than Agriculture and Astronomy. A moment's consideration, however, will show that they have one point in common: both are at the mercy of the weather. (p425)
Furthermore, only two years earlier, Student (William Sealy Gosset, 1976-1937), whose work involved regular contact with problems of agricultural experiments, had published his later-to-become-famous paper The Probable Error of A Mean [3]. This was in many ways in advance of that of Wood and Stratton. Presumably, they were unaware of Student’s work but we now know that Student himself had been anticipated in 1876 by Jakob Luroth(1844-1910) [4], a German mathematician who was originally an astronomer, so the story of astronomers and agronomists advancing the theory of errors by stumbling past each other has some history.
An interesting connection (it has perhaps a causal explanation and cannot be marked down definitively as a coincidence) is that both Wood and Stratton had connections to Caius College Cambridge, as did Fisher.
Starting in the middle
I am going to pick up the story with the second of these statisticians. Frank Yates studied mathematics at Cambridge, graduating in 1924 and after a brief period teaching at Malvern college worked from 1927-1931 as a surveyor in what is now Ghana [5]. This either honed or provided an outlet for a talent for efficient computation and developing effective algorithms. Surveying required a lot of calculation using least squares and as David Finney put it [6]:
Gaussian least squares was not a topic then taught to undergraduate mathematicians; the need for regularly using this technique undoubtedly developed in him the concern for efficient, well-organised, and accurate computation that characterised his later career. (p2)
Interestingly, Yates never saw the need for matrix algebra and generations of statisticians working at Rothamsted subsequently had to hide their interest in matrices from the head of statistics!
On his arrival at Rothamsted, Yates started collaborating with Fisher, developing, in particular, the work on the design and analysis of experiments; he achieved much rapidly. A good example is given by his Royal Statistical Society(RSS) read paper of 1935, ‘Complex Experiments’ [7]. This presents a dazzling array of ideas with much of what has become standard theory to support them, but is also grounded in application. Many of the ideas come directly from Fisher, some indirectly, but there are also many felicitous and ingenious touches that are clearly due to Yates. In it he covers complex treatment structures, in particular for factorial designs, but also how to deal with different sources of variation in the experimental material, including their influence on efficient estimation and appropriate error estimation, for example for incomplete block designs, a topic he was to develop more fully the following year. [8]
As was usual for a read paper, a number of commentaries were also published. Neyman pointed out that interactive effects in factorial experiments would be estimated with low precision. Yates changed his definition in the published version of the paper from the version read to the RSS and in reply to Neyman added the remark:
Since the meeting, I have altered my definition of an interaction by the inclusion of a factor 1/2, for reasons stated in the text. (p247)
This had the effect of reducing the standard error. However, this response was not quite fair. I once discussed this with Michael Healy, a statistician who also worked at Rothamsted, and he agreed with me that however useful this modification might be algorithmically, it was not an answer to Neyman’s criticism.
Back to the beginning: Fisher's insight into the interplay of block and treatment structure
In his published comment on Yates’s read paper, Fisher drew attention to two aspects of any experiment (in Genstat we now call these the block structure and the treatment structure). He gave an example of a field with plots arranged in five rows and five columns, with each of the 25 plots subdivided into two, giving 50 units and thus 49 degrees of freedom in total. As an example of the second kind, he considered studying two factors: one with five levels and one with two with each combination studied with five replications, making 5 x 2 x 5 = 50 applications and again 49 degrees of freedom. He then stated:
The choice of the experimental design might be regarded as the choice of which items in the first analysis were to correspond to any chosen items in the second, and this could be represented by a two-way analysis of the 49 elements.
In other words, it was the way that the treatment structure mapped onto the block structure that guided the way that the experiment was to be analysed and, of course, the anticipated analysis would guide the way the experiment should be designed.
An example of a modern application of Fisher’s insight is shown in the following image, which gives the Genstat code I used to carry out analysis of variances for three possible treatment models, defined by TREATMENTSTRUCTURE commands, on a cross-over design for which the basic experimental units were defined by the BLOCKSTRUCTURE command.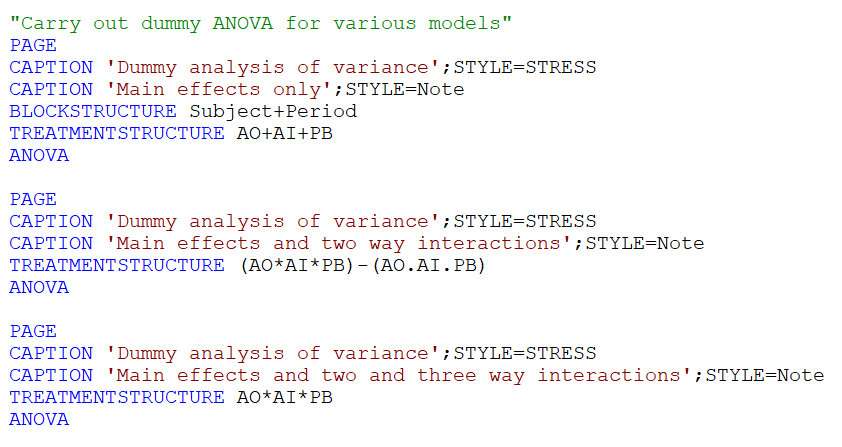
Use of the ANOVA command without mentioning an outcome variable gives me a so-called dummy analysis, showing how the degrees of freedom should be apportioned but not, of course, giving me a full analysis since no outcome data are used. The example is described in a blog of mine: https://www.linkedin.com/pulse/designed-inferences-stephen-senn/.
Well before Yates’s arrival at Rothamsted, Fisher had realised that these distinctions between block and treatment structure were crucial and that in particular careful attention had to be paid to the former when calculating errors. He had, however, learned by making mistakes. Two years after Fisher’s death, in reviewing his contributions to experimental design, in commenting on an early example dating from 1923 of Fisher analysing a complex experiment, Yates, having first criticised the design, wrote:
To obtain a reasonable estimate of error for these interactions, however, the fact that the varietal plots were split for the potash treatments should have been taken into account. This was not done in the original analysis, a single pooled estimate being used...
But adding:
The need for the partition of error into whole-plot and sub-plot components was recognised by 1925. Part of the data of the above experiment was re-analysed in Statistical Methods for Research Workers in the now conventional form. (P311-312)
Fisher had taught himself fast. [9]
In fact, by the appearance of his classic text Statistical Methods for Research Workers [10], Fisher had developed analysis of variance (indeed, the term variance is due to him), the principles of blocking and replication, and his most controversial innovation, randomisation. An important point about this is still regularly misunderstood. As Fisher put it:
In a well-planned experiment, certain restrictions may be imposed upon the random arrangement of the plots in such a way that the experimental error may still be accurately estimated, while the greater part of the influence of heterogeneity may be eliminated. [11] (p232)
Thus, randomisation was not an alternative to balancing known influences but an adjunct to it.
As Yates put it in summing up what Fisher had achieved:
Apart from factorial design, therefore, all the principles of sound experimental design and analysis were established by 1925. [9] (p312)
On to the end
One day John Nelder was analysing a complex experiment. He was doing so in the tradition of Fisher and Yates. This is what he subsequently had to say about it:
During my first employment at Rothamsted, I was given the job of analyzing some relatively complex structured experiments on trace elements. There were crossed and nested classifications with confounding and all the rest of it, and I could produce analyses of variance for these designs. I then began to wonder how I knew what the proper analyses were and I thought that there must be some general principles that would allow one to deduce the form of the analysis from the structure of the design. The idea went underground for about 10 years. I finally resurrected it and constructed the theory of generally balanced designs, which took in virtually all the work of Fisher and Yates and Finney and put them into a single framework so that any design could be described in terms of two formulas. The first was for the block structure, which was the structure of the experimental units before you inserted the treatments. The second was the treatment structure—the treatments that were put on these units. The specification was completed by the data matrix showing which treatments went on to which unit. [12] (P125)
I have quoted this at length because it leaves me little else to say. John was able to unify the developments of Fisher and Yates and others, (David Finney is mentioned) so that a wide range of experimental designs could be analysed using a single general approach. The results were published in two papers in the Proceedings of the Royal Society [13], [14] in 1965, one of which did, indeed cover block structure and the other treatment structure.
Was that it?
No. Not at all. What Nelder established was that a general algorithm could be used and that hence a computer package could be written to implement it. After his arrival as head of statistics at Rothamsted, he was able to direct the development of Genstat, the software that was designed to implement his theory. However, many others worked on this [15], particularly notable being the contributions of Roger Payne, who continues to develop it to this day. An irony is that whereas one of John Nelder’s other seminal contributions to statistics, Generalised Linear Models, has been taken up by every major statistical package, (as far as I am aware) Genstat is the only one to have implemented the Rothamsted School approach to analysing designed experiments. Thus, when the Genstat user proceeds to analyse such an experiment by first declaring a BLOCKSTRUCTURE and then a TREATMENTSTRUCTURE before proceeding to request an ANOVA they are using software that is still ahead of its time but based on a theory with a century of tradition.
About the author
Professor Stephen Senn has worked as a statistician but also as an academic in various positions in Switzerland, Scotland, England and Luxembourg. From 2011-2018 he was head of the Competence Center for Methodology and Statistics at the Luxembourg Institute of Health. He is the author of Cross-over Trials in Clinical Research (1993, 2002), Statistical Issues in Drug Development (1997, 2007,2021), and Dicing with Death (2003). In 2009 he was awarded the Bradford Hill Medal of the Royal Statistical Society. In 2017 he gave the Fisher Memorial Lecture. He is an honorary life member of PSI and ISCB.
Stephen Senn: Blogs and Web Papers http://www.senns.uk/Blogs.html
References
1. Wood TB, Stratton F. The interpretation of experimental results. The Journal of Agricultural Science. 1910;3(4):417-440.
2. Airy GB. On the Algebraical and Numerical Theory of Errors of Observations and the Combination of Observations. MacMillan and Co; 1862.
3. Student. The probable error of a mean. Biometrika. 1908;6:1-25.
4. Pfanzagl J, Sheynin O. Studies in the history of probability and statistics .44. A forerunner of the t-distribution. Biometrika. Dec 1996;83(4):891-898.
5. Dyke G. Obituary: Frank Yates. Journal of the Royal Statistical Society Series A (Statistics in Society. 1995;158(2):333-338.
6. Finney DJ. Remember a pioneer: Frank Yates (1902‐1994). Teaching Statistics. 1998;20(1):2-5.
7. Yates F. Complex Experiments (with discussion). Supplement to the Journal of the Royal Statistical Society. 1935;2(2):181-247.
8. Yates F. Incomplete randomized blocks. Annals of Eugenics. Sep 1936;7:121-140.
9. Yates F. Sir Ronald Fisher and the design of experiments. Biometrics. 1964;20(2):307-321.
10. Fisher RA. Statistical Methods for Research Workers. Oliver and Boyd; 1925.
11. Fisher RA. Statistical Methods for Research Workers. In: Bennett JH, ed. Statistical Methods, Experimental Design and Scientific Inference. Oxford University; 1925.
12. Senn SJ. A conversation with John Nelder. Research Paper. Statistical Science. 2003;18(1):118-131.
13. Nelder JA. The analysis of randomised experiments with orthogonal block structure I. Block structure and the null analysis of variance. Proceedings of the Royal Society of London Series A. 1965;283:147-162.
14. Nelder JA. The analysis of randomised experiments with orthogonal block structure II. Treatment structure and the general analysis of variance. Proceedings of the Royal Society of London Series A. 1965;283:163-178.
15. Senn S. John Ashworth Nelder. 8 October 1924—7 August 2010. The Royal Society Publishing; 2019.
Popular


Related Reads